


Yellow Springs Schools— Holden responds to report card results
- Published: October 3, 2019

While Yellow Springs Schools administrators have long found fault in the usefulness of the state’s yearly testing system, new Superintendent Terri Holden believes the district has something to learn from the results.
The state’s annual district report cards, based mostly on the results of those tests, were released earlier this month. Yellow Springs received a “C” overall for the 2018–19 school year, down from a “B” for the prior year. The overall grade combines the grades of six different categories measured by the state.
“There are districts that would be happy with the grades we got,” Holden said Thursday, Sept. 12, during the most recent regular school board meeting.
Most of Ohio’s 608 districts received a “B” or “C” on the latest report card.
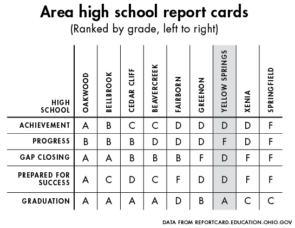
At the far ends of the spectrum, 31 districts, including Oakwood in nearby Montgomery County, got an “A,” while four, including Springfield City Schools in Clark County, received an “F”. About 120, including Greenon, also in Clark County, received a “D.”
In Greene County, Beavercreek and Bellbrook-Sugarcreek schools got a “B”; Cedar Cliff, Fairborn and Greeneview, like Yellow Springs, got a “C”; and Xenia got a “D.”
While Yellow Springs landed alongside many of its neighbors, and received an “A” in several individual categories, Holden said the local scores, rightly or wrongly, do not give a favorable impression of the district.
“This sends a message we may not want to send,” she said.
In the six individual categories assessed, Yellow Springs’ grades ranged from “A,” for graduation rates, to “D,” for “prepared for success.”
A “C” was given in each of the categories of “achievement,” “progress” and “gap closing.” The sixth category, “improving at-risk K–12 readers,” was not given a grade, as the number of applicable students was too low.
Mills Lawn Principal Matt Housh noted that all third-grade students last year passed the reading test that determines grade promotion, referred to as the “third-grade guarantee.”
Achievement compared
Of the six graded categories, “achievement” is the one that is most widely ranked and cited by media and other observers.
The “achievement” grade combines two components: the percentage of prescribed “indicators” that were met and the points accumulated in a “performance index.”
The state’s 24 indicators include individual grade and subject scores, as well as gifted service measurements and absentee figures. An 80% passage rate is needed to meet each of the test indicators.
The performance index takes into account all the test results, with bonus points added for scores above proficiency, which is set at 80%.
Yellow Springs received 89.6 points out of a possible 120, for a 74.7% “C” score, in the performance index rating, compared to 93.956 points the year before.
Ranked against the rest of Ohio’s 608 districts, the number put Yellow Springs right in the middle, at 304 for 2018–19, dropping from 198 the year before.
For comparison, Oakwood was the highest ranking district in the area, 11th in the listed ratings, with 107.55 points; while Jefferson Twp., also in Montgomery County, was close to the bottom at 605, with 57.193 points.
The state’s top rated school, Solon in Cuyahoga County, had 112.623 points. The lowest, East Cleveland City Schools, also in Cuyahoga County, had 55.279.
As for the 24 separate indicators, Yellow Springs met nine, earning the district an “F” in that area.
The indicators met were: third- and fifth-grade English language arts; fourth-grade mathematics; high school American U.S. government, American U.S. history, biology, English language arts I and EOC improvement; and absenteeism.
Not met were: third-, fifth-, sixth-, seventh- and eighth-grade mathematics; fourth-, sixth-, seventh- and eighth-grade English language arts; fifth- and eighth-grade science; high school English language arts II, mathematics I and mathematics II; and gifted measures. No scores were calculated for algebra I and geometry, which are not offered as distinct classes.
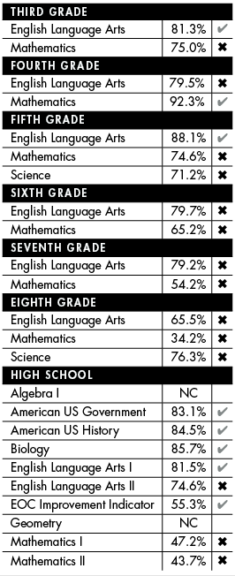
Test-based state indicators measure the percent of students who have passed state tests. Test results are reported for each student in a grade and subject. The passage rate for each test indicator is 80% and the End of Course (EOC) Improvement Indicator is 25%. Data from reportcard.education.ohio.gov
In addition to the overall district grades, the state assigns grades in each of the categories for individual schools. Mills Lawn’s overall grade was a “B,” with a “C” in achievement, a “B” in progress and an “A” in “gap closing.”
The high/middle school got a “C” overall, with a “D” in achievement, an “F” in progress, a “D” in gap closing and an “A” in graduation rate.
An educator’s concerns
Villager Allen Hunt, who is on the physics faculty at Wright State University, wrote in an email that he is concerned about local students’ readiness for college.
“At Wright State, we have 85% of incoming students needing remedial math and 15% needing remedial English, and these lacks are determined by standardized testing.”
Yellow Springs’ 2018–19 test scores indicate that local students will have difficulty at the college level, he believes.
“The [latest] results seem to suggest something seriously wrong in YS,” he continued. “Our high school has slipped from Beavercreek level ratings to between Fairborn and Xenia.”
In making her preliminary report to the school board, Holden noted that some of the indicators were missed by just one or two percentage points, but she added that they still illustrated areas where more work is needed.
Board member Sylvia Ellison pointed out that percentages can swing more widely at small schools like Yellow Springs. A single student can make a difference in final test scores.
Holden agreed, but said that achieving better results is possible.
Noting that the tests “don’t measure all of the things we think are important,” Holden said they are nonetheless based on the state standards.
As such, “if we backward design and plan around [the standards], we should see results around that,” she said.
“If we are doing the right things in the classroom, and if we are wrapping project-based learning around the standards, we should see results.”
Improving the outcomes
In a followup interview, Holden said she appreciates the district’s institutional opposition to state testing and the state report card.
Studies have shown that test scores and resulting report card grades are often lower in small and/or low-income districts, suggesting an “inherent” bias, Holden said.
What’s more, such measures as the gifted indicator and the “prepared for success” category, “give a false impression of what is really being measured,” Holden said.
Districts such as Yellow Springs that don’t have a gifted program are penalized when points are compiled.
And one of the measures for being “prepared for success” is fundamentally skewed, she said. While it ostensibly looks at the number of local graduates who go on to finish college, the numbers are limited to those attending public institutions in Ohio, and even then, only if the school self-reports.
People looking at the resulting number will think “that is terrible,” Holden said, but it doesn’t account for all the students attending private colleges or going out of state for higher education.
The same “prepared for success” category also compiles the number of students taking the ACT test and gives bonus points for students taking college credit classes, or CCC, and getting a three or higher on an Advanced Placement, or AP, exam, which are scored from one to five..
Holden finds that problematic and biased against schools that don’t have the size or means to offer CCC or AP opportunities.
“This was a frustration for me as a high school principal,” she said.
“But I also believe we need a metric for what we do,” Holden added. “It’s how our peers are measured, and how some in the community compare us. How do we say we’re doing just as good a job or a better job than our neighbors?”
The answer for Holden is to focus on the state-mandated standards established by the Ohio Department of Education for each grade level and individual subject.
Holden noted that all the standards have been revised in the past two years.
“We need to pay attention to the standards,” she said. “I’m not about teaching to the tests. But if the tests are based on the standards, then we should be teaching to the standards.”
She said she intends to work with the district’s principals and teachers this year in refining the district’s understanding of the new standards and ensuring their inclusion in classroom work.
“That’s the approach we need to take to get at the achievement” ratings, she said.
Contact: csimmons@ysnews.com


Comments are closed for this article.