


(Submitted photo)
Facilities survey— Many reluctant to hike taxes
- Published: May 21, 2021

The results of a new survey that polled Yellow Springs school district voters about their views concerning local school facilities — and the anticipated $30 million to $35 million cost to undertake major renovations or build new — suggest a dilemma for district leaders.
Basically, respondents favored upgrades and/or construction, but they balked at the price tag.
The survey shows a majority of the polled voters answering positively to the prospect of renovating the buildings and even the possibility of constructing a new K–12 campus where the middle/high school currently sits, but they didn’t share an accompanying willingness to foot the expected multi-million-dollar bill. The response may not bode well for the success of a facilities levy on the ballot in November, when the district intends to put a plan before voters.


Respondents “against” outnumbered those “for” either a new property tax (43.4–39.7%, with 17% unsure) or a combined property and income tax (45.4–39%, with 15.6% unsure) to raise the sum needed to build a K–12 facility, the option for which district leaders have expressed a preference. As for respondents’ feelings about financing an alternative renovation plan, the survey didn’t ask.
The survey, conducted March 29 through April 11 by Fallon Research & Communication Inc., a national firm with offices in Columbus and Washington, D.C., consisted of 21 questions, four of which concerned the demographics of the respondents. In addition, those who answered negatively to supporting the proposed tax measures were asked to share the “biggest reason” for their opposition.
A random sample of district registered voters were contacted by phone call or text during the two-week survey period. Those reached by text were sent a link to answer the survey questions online, causing concern among some recipients about the authenticity of the unsolicited invitation.
All told, 132 registered voters participated in the polling, according to Fallon Research data, which the News acquired from the district through a public records request.
District Superintendent Terri Holden said earlier this spring that the goal was to garner feedback from 150–200 people. The projected number is typical of a random sample survey, a common survey approach that by definition seeks responses from a percentage of a population or group in which every potential respondent has the same probability of being chosen.
The opinion that taxes are already too high was the overwhelming most common reply of the 56 respondents against a new levy, at 45.9%. An additional 10.8% of the oppositional subgroup said they couldn’t afford any tax increase. Further breakdown of the responses, compiled by Fannon Research, shows: 18.1% indicated they don’t like the K–12 plan; 12.7% said the current buildings are in good condition and major improvements aren’t needed; 7.6% expressed the view that money has not been or will not be spent properly by the district; 3.2% were defined as “other”; and 1.6% were unsure or gave no answer.
“I already pay taxes that are considered extremely high compared to neighboring communities,” wrote one respondent. “At the suggested rate hikes, I might as well move to another community and put my child in another district. What about sourcing other funds? What about the children that attend Yellow Springs whose families do not own property or live in Yellow Springs? How will they pay the same tax that I am paying?”
Satisfaction with the current buildings and a desire to keep Mills Lawn School in the center of town were among other reasons listed.
“They don’t need a new school,” wrote one respondent. “I don’t believe we need a new building,” wrote another. “The elementary school should be separate from high and middle school, and I like the location where it is,” responded a third.
Another participant expressed lingering distrust of district leaders in the wake of the previous attempt to pass a facilities levy.
“I don’t think the school board is being honest,” the participant wrote. “They were not honest with us two years ago.”
There is no evidence that board members were dishonest about the previous master planning process, but some community members found fault with what they saw as a lack of transparency in the decision-making process. In addition, a factually erroneous advertisement distributed by the pro-levy committee prompted criticism toward the entire 2018 effort.
Whether accurate or not, negative perceptions will play a part in how voters cast their ballot.
The superintendent has said that the results of the survey, as well as the predominantly positive feedback from three public forums held in February and March, would be considered in determining the facilities master plan recommendation yet to be approved by the school board. She had hoped to present a recommendation before the end of April, but when asked at the start of May about the recommendation status, she said the matter would go before the board at its next regularly scheduled meeting Thursday, May 13.
Rating the district
The survey began with general questions about the area and district.
Number one was whether respondents feel Greene County is “going in the right direction” or “gotten off onto the wrong track.” And number two asked the same of the Yellow Springs school district.
Respondents were more favorable about the school district than the county. For the district, 53.2% said right direction, 27.2% said wrong track and 19.6% indicated uncertainty or didn’t answer. For the county, 35.7% said right direction, 20.5% said wrong track and 43.9% replied that they were unsure or gave no answer.
Asked then to rate the quality of the education being provided by the local school district, 29.5% of survey participants chose “excellent,” 48% indicated “good,” 11% picked “fair, 1.7% said “poor,” 3.2% chose “very poor,” and 6.5% responded as unsure or gave no answer. Fallon’s assessment noted that the positive rating, combining excellent and good, far outpaced the negative, combining poor and very poor, at 77.5% positive to 4.9% negative.
Respondents were less effusive, though still positive, in answering the follow-up question asking participants to rate the district’s job “spending tax money and managing its budget.” The 49.5% positive response included 11% indicating “excellent” and 38.5% choosing “good.” The 15.3% negative rating combined 10.9% answering “poor” and 4.4% responding “very poor.” In addition, 24.4% replied “fair,” and 10.8% said they were unsure or gave no answer.
Concerning the school buildings
The next section of the survey turned to the district’s current school buildings.
Asked whether participants think Mills Lawn Elementary is a “good facility that needs no major improvements; an adequate facility that needs some updating, but no rebuilding; a poor facility that needs to be replaced” or are not “familiar enough to have formed an opinion.” respondents answered: 11.4% good, 41.7% adequate, 26.2% poor, 18% not familiar and 2.6% unsure or no answer.
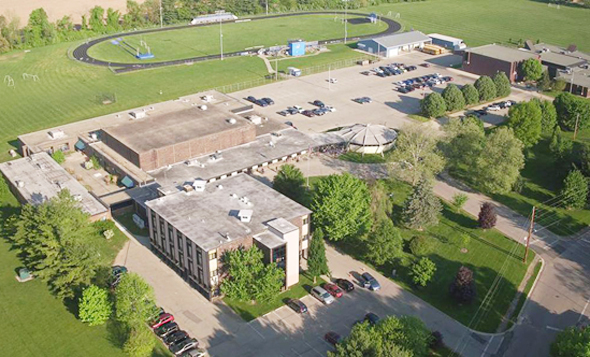
Asked the same about the McKinney Middle School and Yellow Springs High School campus, participants answered: 5% good, 34.5% adequate, 40.6% poor, 14.8% not familiar and 5% unsure/no answer.
Before continuing with more questions, the survey script then stated: “As you may or may not know, because of the ages and conditions of the current buildings, it now costs more to repair them to modern standards than it would to replace them.”
The followup question to that statement asked: “Generally speaking, do you support or oppose replacing them with a single new kindergarten through 12th grade school building that would be located on the site of the current McKinney Middle, Yellow Springs High School building?”
The reply was 56% in support, 35.4% in opposition and 8.6% unsure/no answer.
Continuing along the same vein, the next two questions — which were presented in different order to respondents — addressed financial considerations.
One: “Does knowing that, because of their ages and conditions, to keep the existing buildings serviceable, every year an increasing amount of operating money will have to be redirected from classrooms and learning programs, make you more or less likely to support replacing them with a single new kindergarten through 12th grade school building for all grades or does it make no difference in your opinion?”
The responses: 45.9% more likely, 7.9% less likely, 34.5% no difference and 11.7% unsure/no answer.
Two: “Does knowing that the school district can receive $9 million dollars of future reimbursement funds offered by the State if they replace the buildings, make you more or less likely to support replacing them with a single new kindergarten through 12th grade school buildings for all grades, or does it make no difference in your opinion?”
The responses: 57.2% more likely, 6.9% less likely, 29.9% no difference and 6.1% unsure/no answer.
The breakdown of percentages may also reflect irritation on the part of some participants in the nature of the questions, which they described as “leading” and “biased” on social media and in private conversations afterward.
A K–12 plan
The next section of the survey asked four questions dealing with “aspects of the plan to construct a new K through 12 building to replace the existing ones,” with the remainder of the survey focusing on a K–12 facility. None of the renovation options previously presented to the community, alongside that of a new K–12 facility, were presented.
Respondents were asked to rate separately the level of priority they felt to:
• “Have a building with a healthy, cost-saving and energy-efficient climate control system”
• “Have a modern facility that can meet the needs of students with disabilities and mobility limitations”
• “Have electrical infrastructure needed to support 21st century technology and learning labs that students will need, in order to be prepared for college or the workforce”
• “Have a safer building with state-of-the-art smoke detection, fire suppression, security systems and entrance vestibules to screen visitors, in order to prevent unauthorized intrusions”
A clear majority gave a “high” priority to all four questions, and when next asked if “generally speaking,” they supported or opposed replacing the existing buildings with a new K–12 facility on East Enon Road, 53.4% answered in support, 33.3% opposed and 13.3% expressed uncertainty or gave no answer.
Nevertheless, when the followup and final plan-related questions asked whether they would vote for a property tax or a combined property/income tax, more respondents said “no” than “yes.”
Narrative responses
Property owners indicated that they are feeling strained.
“The burden is always on property owners,” said one. “Taxes are already substantial to live here, along with utility costs being high. I’m not interested in those going up,” replied another.
One participant worried that a tax increase would impede their ability to become a homeowner here.
“I want to be a homeowner, and this would mean having to be taxed [too] much.”
One respondent said they didn’t see much difference from the failed 2018 master plan proposal, which took a phased approach toward upgrading school facilities, beginning with an $18 million combined renovation/new construction at the middle/high school campus while waiting until an undesignated time to address Mills Lawn.
“This district is taking the same stand as before,” they wrote.
A perceived point of view in the survey questions provoked one respondent: “Asking me the obviously extremely important questions about wheelchair access and electrical? You are required to have those even in the current building. The survey questions seemed slanted.”
Another thought the stated costs were lower than will be needed, and that the final amount will be too much.
“It’s going to cost more than that,” they wrote. “We don’t want to force people out of town by making it too expensive for normal people to live here.”
Another mourned the possible abandonment of beloved structures.
The K–12 plan “does not preserve the public investment made by previous generations,” the respondent said. “We shouldn’t start from scratch. We are a small village. In keeping, we should upgrade the school buildings in a disciplined, phased approach. Many buildings in the region and village are older than the Mills Lawn School. I’m against casting that beautiful facility on the garbage heap.”
Survey demographics
A demographic profile of survey respondents showed a binary gender split of 54.9% female and 45.1% male. Age ratios were 43.9% at 65 and older, 31.4% at 45 to 64 and 24.8% at 18 to 44, according to Fallon Research’s data.
Fallon’s racial breakdown lists: 80.3% “white,” 10% “African American,” 1.2% “Hispanic or Latino,” 1.1% “Asian or Indian,” 3.1% “something else” and 3.1% “unsure/no answer. Additionally, 1.2% of the respondents volunteered the answer “mixed race.”
In answer to whether respondents have any children enrolled in Yellow Springs public schools, 76% said they do not, 22.7% replied affirmatively and 1.2% were unsure or gave no response.
The demographic variables of the survey are consistent with the latest results of the American Community Survey, or ACS, for the village of Yellow Springs, not including the portion of the district that extends beyond the village limits.
According to the 2021 ACS, based on Census data, Yellow Springs is 54.11% female and 45.89% male. Local age skews older, with a majority of residents over the age of 50. The racial composition is 82.36% white, 11.73% Black or African American, 4.26% of two or more races and 1.55% Asian. “Native American,” “Native Hawaiian or Pacific Islander” and “other race” are each listed as 0% in the ACS data, which does not match anecdotal knowledge of the village’s residential makeup.
One Response to “Facilities survey— Many reluctant to hike taxes”
The Yellow Springs News encourages respectful discussion of this article.
You must login to post a comment.
Don't have a login? Register for a free YSNews.com account.


I find it very strange that the article ends by stating that the ACS data “does not match anecdotal knowledge of the village’s residential makeup.” What a bizarre claim! In the first place, as every statistician like me knows, “anecdotes are not data”. Whose “anecdotal knowledge” is this, anyway?
I trust the ACS data much more than anyone’s anecdotes and I find it reassuring that the demographic profile of the survey respondents closely match the ACS data. That is a piece of evidence that the survey actually did use a random sample, as is claimed in the article. I would have liked to see a larger sample size, but the one used was probably adequate for the purpose.